
ProfilingManager supports capturing profiles based on system triggers. The
system manages the recording process and provides the resulting profile to your
app.
Triggers are tied to performance-critical events. System-recorded profiles provide detailed debugging information for the critical user journeys (CUJs) associated with these triggers.
Capture historical data
Many triggers require analyzing the historical data leading up to the event. The trigger itself is often a consequence of an issue rather than the root cause. If you start a profile only after the trigger occurs, the root cause can already be lost.
For example, a long-running operation on the UI thread causes an Application Not Responding (ANR) error. By the time the system detects the ANR and signals the app, the operation might have finished. Starting a profile at that moment misses the actual blocking work.
Predicting exactly when some triggers occur is unfeasible, making it impossible to manually start a profile in advance.
Why use trigger-based capture?
The primary reason to use profiling triggers is to capture data for unpredictable events where it's impossible for an app to start recording manually before these events occur. Profiling triggers can be used to:
- Debug performance issues: Diagnose ANRs, memory leaks, and other stability problems.
- Optimize critical user journeys: Analyze and improve flows, for example, app startup.
- Understand user behavior: Gain insights into events, for example, user-initiated app exits.
Set up a trigger
The following code demonstrates how to register for the
TRIGGER_TYPE_APP_FULLY_DRAWN trigger and apply rate limiting to it.
Kotlin
fun recordWithTrigger() { val profilingManager = applicationContext.getSystemService(ProfilingManager::class.java) val triggers = ArrayList<ProfilingTrigger>() val triggerBuilder = ProfilingTrigger.Builder(ProfilingTrigger.TRIGGER_TYPE_APP_FULLY_DRAWN) .setRateLimitingPeriodHours(1) triggers.add(triggerBuilder.build()) val mainExecutor: Executor = Executors.newSingleThreadExecutor() val resultCallback = Consumer<ProfilingResult> { profilingResult -> if (profilingResult.errorCode == ProfilingResult.ERROR_NONE) { Log.d( "ProfileTest", "Received profiling result file=" + profilingResult.resultFilePath ) setupProfileUploadWorker(profilingResult.resultFilePath) } else { Log.e( "ProfileTest", "Profiling failed errorcode=" + profilingResult.errorCode + " errormsg=" + profilingResult.errorMessage ) } } profilingManager.registerForAllProfilingResults(mainExecutor, resultCallback) profilingManager.addProfilingTriggers(triggers)
Java
public void recordWithTrigger() { ProfilingManager profilingManager = getApplicationContext().getSystemService( ProfilingManager.class); List<ProfilingTrigger> triggers = new ArrayList<>(); ProfilingTrigger.Builder triggerBuilder = new ProfilingTrigger.Builder( ProfilingTrigger.TRIGGER_TYPE_APP_FULLY_DRAWN); triggerBuilder.setRateLimitingPeriodHours(1); triggers.add(triggerBuilder.build()); Executor mainExecutor = Executors.newSingleThreadExecutor(); Consumer<ProfilingResult> resultCallback = new Consumer<ProfilingResult>() { @Override public void accept(ProfilingResult profilingResult) { if (profilingResult.getErrorCode() == ProfilingResult.ERROR_NONE) { Log.d( "ProfileTest", "Received profiling result file=" + profilingResult.getResultFilePath()); setupProfileUploadWorker(profilingResult.getResultFilePath()); } else { Log.e( "ProfileTest", "Profiling failed errorcode=" + profilingResult.getErrorCode() + " errormsg=" + profilingResult.getErrorMessage()); } } }; profilingManager.registerForAllProfilingResults(mainExecutor, resultCallback); profilingManager.addProfilingTriggers(triggers);
The code performs these steps:
- Get the manager: Retrieves the
ProfilingManagerservice. - Define a trigger: Builds a
ProfilingTriggerforTRIGGER_TYPE_APP_FULLY_DRAWN. This event occurs when the app reports that it has finished startup and is interactive. - Set rate limits: Applies a 1-hour rate limit to this specific trigger
(
setRateLimitingPeriodHours(1)). This prevents the app from recording more than one startup profile per hour. - Register listener: Calls
registerForAllProfilingResultsto define the callback that handles the result. This callback receives the path of the saved profile throughgetResultFilePath(). - Add triggers: Registers the trigger list with
ProfilingManagerusingaddProfilingTriggers. - Fire event: Calls
reportFullyDrawn(), which emits theTRIGGER_TYPE_APP_FULLY_DRAWNevent to the system triggering a profile collection assuming a system background trace was running and there is rate limiter quota available. This optional step demonstrates an end-to-end flow because your app must callreportFullyDrawn()for this trigger.
Retrieve the trace
The system saves trigger-based profiles in the same directory as other profiles. The filename for triggered traces follows this format:
profile_trigger_<profile_type_code>_<datetime>.<profile-type-name>
You can pull the file using ADB. For example, to pull the system trace captured with the example code using ADB, it might look like this:
adb pull /data/user/0/com.example.sampleapp/files/profiling/profile_trigger_1_2025-05-06-14-12-40.perfetto-trace
For details on visualizing these traces, see Retrieve and analyze profiling data.
How background tracing works
To capture data from before a trigger, the OS periodically starts a background trace. If a trigger occurs while this background trace is active and your app is registered for it, the system saves the trace profile to your app's directory. The will then profile include information that led up to the trigger.
Once the profile is saved, the system notifies your app using the callback
provided to registerForAllProfilingResults. This callback privdes the path to
the captured profile which can be accessed by calling
ProfilingResult#getResultFilePath().
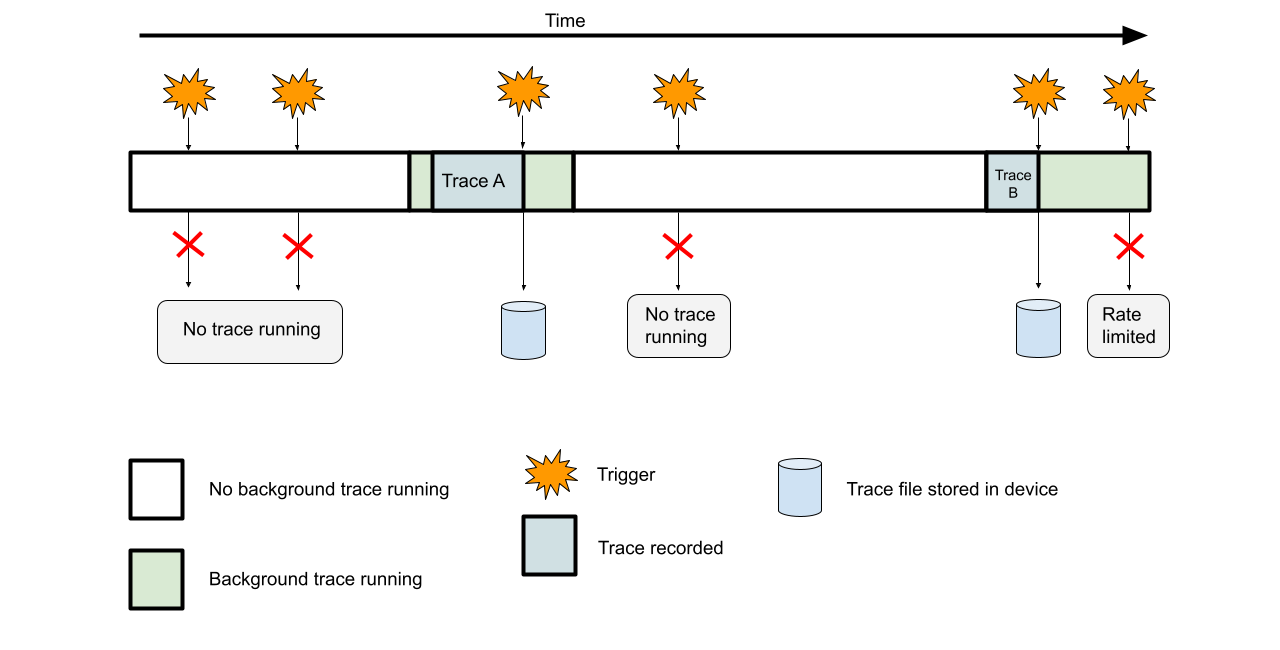
To reduce the impact on device performance and battery life, the system doesn't run background traces continuously. Instead, it uses a sampling method. The system randomly starts a background trace within a set timeframe (with a minimum and maximum duration). Randomly spacing these traces improves trigger coverage.
System-triggered profiles have a system-defined maximum size, so they use a ring buffer. Once the buffer is full, new trace data overwrites the oldest data. As shown in Figure 1, a captured trace might not cover the entire duration of the background recording if the buffer fills up; instead, it represents the most recent activity leading up to the trigger.
Implement trigger-specific rate limiting
High-frequency triggers can quickly consume your app's rate limiter quota. To better understand the rate limiter, we encourage you to look at How rate limiter works. To prevent a single trigger type from exhausting your quota, you can implement trigger-specific rate limiting.
ProfilingManager supports app-defined trigger-specific rate limiting. This
lets you add another layer of time-based throttling in addition to the existing
rate limiter. Use the setRateLimitingPeriodHours API to set a specific
cooldown time for a trigger. After the cooldown expires, you can trigger it
again.
Debug triggers locally
Because background traces run at random times, debugging triggers locally is hard. To force a background trace for testing, use the following ADB command:
adb shell device_config put profiling_testing system_triggered_profiling.testing_package_name <com.example.myapp>
This command forces the system to start a continuous background trace for the specified package, allowing every trigger to be able to collect a profile if rate limiter allows.
You can also enable other debug options, for example, disabling the rate limiter when debugging locally. For more information, see Debug commands for local profiling.